In investigating the proper means to declare a global variable, I found myself reviewing some C documentation that I had long forgotten, concerning the Storage Class.
To briefly review, each variable declaration consists of 3 elements: the storage class, the type, and the variable name. For example:
auto int x;

static int y;
The storage class can take the form of auto, extern, static, or register. If not specified, the implicit storage class is that of auto.
The auto storage class is the most frequently used of the classes, primarily because it is the implicit default. Local variables take this form, where the storage is not allocated until the block in which the variable is defined is entered.
The extern storage class specified simply a reference to a variable that is defined elsewhere. Space is therefore not allocated upon encountering this reference, since the storage is allocated elsewhere. This as you may recall is the means to declare a global variable.
The static storage class specifies that the variable cannot be access by functions outside the translation unit in which it was defined. A common error is declaration of a static variable in a header file, which is imported by more than one translation unit not understand that each translation unit essentially created independent copies of the variable. A common practice of declaring a static constant in a header, used by multiple translation units results in multiple copies of the constant, in each translation unit. However, if the static variable simply defines a constant....generally, no-harm-no-foul. It is however worth understanding that it is not a shared reference.
The last storage class is that of register, which notifies the compiler to make the variable as efficient as possible. Ideally, the variable will retain it's location in a cpu register for optimal performance.
This particular blog post teeters on that fine line of ridiculously obvious and pure genius.
It's not too uncommon to provide output of a particular data structure that can take the form of singular or plural content. Because we're often in a rush, we sometimes sacrifice a more thoroughly thought out implementation for speed of implementation, sloppy but fast.
The result, duplicating assignment of output assignments like this:
if ( list.size() <= 1)
{
printf("(%s:%d) found %ld identifier %s\n",__FILE__,__LINE__,list.size(),oss.str().c_str());
}
else
{
printf("(%s:%d) found %ld identifiers %s\n",__FILE__,__LINE__,list.size(),oss.str().c_str());
}
Copy-n-pasted statements are notorious for falling out of sync and can complicate the intended usage (e.g. say overlooking one of the cases when searching through the logs).
Or perhaps worse, simply ignoring or manipulating grammar to fit for both the plural and singular content.
printf("(%s:%d) found identifier list: %s\n",__FILE__,__LINE__,oss.str().c_str());
But if you take a breath you can satisfy both plural and singularity output, which often is simply accomplished by adding an 's' to a word in the string, like this:
printf("(%s:%d) found %ld identifier%s %s\n",__FILE__,__LINE__,list.size(),list.size()<=1 ? "": "s", oss.str().c_str());
Full source code example follows. I've taken some liberties mixing C & C++ syntax for convenience and to demonstrate the principle rather than using solid coding practices. The same principle can be applies to pure-C or pure-C++ implementations.
I'll be the first to admit, I'm a bit of a dinosaur with respect to usage of IDEs. While I'm well versed in Eclipse and other IDE's, I still find myself more efficient when using a multi-window environment, specifically 3-4 editor sessions along side debugging and execution windows. In my native habitat, you'll find me running Linux with 3-4 terminals each with specific source files open (I'm not a tabbed session window man myself), one terminal tail'ing a redirected output file, and one where I run the application redirecting to the output file. Certainly this depends on what I'm working on, but that's a pretty reasonable representation of how I roll.
So what? Well, because I don't use IDEs I don't have the luxury of 'Open Declaration' style features isn't my jam. In the absence of IntelliSense style functionality, I rely on the Unix find command to locate my next source code victim. Despite that, I've had a poor understanding on how to properly use the find command, especially for more sophisticated commands.
For years, I had zero understanding of the ACTIONS options. Casual observation of co-workers over the years seems to imply that many don't, resulting in clumsy, half-azzed usage of it. Few understand the ramifications, specifically whenever you misuse the find command, it causes a puppy to cry. So take heed my tech warrior and prevent the crying of puppies.
So let's set the stage for some find commands.
$ echo "hello" > hello.txt

$ echo "hello world" > helloworld.txt

$ mkdir subdir
$ echo "hello\nworld" > subdir/helloworld2.txt
So as an example of a clumsy misuse of find, for years if I wanted to display the contents of all these text files I'd do something like this:
$ more `find . -name "*.txt"`

::::::::::::::

./subdir/helloworld2.txt

::::::::::::::

hello\nworld

::::::::::::::

./helloworld.txt

::::::::::::::

hello world

::::::::::::::

./hello.txt

::::::::::::::

hello
Similarly, if I wanted to edit each of the files the clumsy command would take the form of:
$ vi `find . -name "*.txt"`
Ugh.
A key contributor to years of misuse is the God-awful syntax for the action commands, a more confusing syntax I've never met. Albeit, incredibly powerful, but seriously.....WTF?
The first part of the command line is reasonable, straight-forward and typical:
$ find [starting-point] [expression]
$ find . -name "*.txt" will search the current directory and subdirectories for file names that match '*.txt'; straight-forward.
Say you want to display the contents of each of the text files like above, proper form is:
$ find . -name "*.txt" -exec more {} \;
Seriously; '{}' & '\;', what fresh hell is this?
I think a turning point for me was the day that I quit quibbling on how ridiculous the syntax is and simply accepted it; Admission, Surrender & Acceptance.
The '-exec' optional parameter takes the general form of '-exec [command] {} \;'. Above we want to run more on each of the files, the list of files is represented by the brackets '{}', the delimited ';' implies it's the end of the command parameters.
Conceptually, the find . -name "*.txt" -exec more {} \; equates to a sequence of commands:
$ find . -name "*.txt"

./subdir/helloworld2.txt

./helloworld.txt

./hello.txt
Followed by:
$ more ./subdir/helloworld2.txt ./helloworld.txt ./hello.txt
Similarly, editing each txt file can be done by:
$ find . -name "*.txt" -exec vi {} \;
No puppies cried in the last two commands.
You're also able to chain commands together. Say for instance you're interested in finding files that contain the word 'hello' in them, the following command will suit the bill:
What if however you want to find files that contain 'hello' and 'world' and not necessarily on the same line, you accomplish that by chaining grep commands as follows:
Earlier this week I was assigned debugging a time-critical bug on a financial system. Reproducing the issue with sufficient consistency is a problem, the suspicion is that slowing the execution of a processing thread would allow reproducing the issue with a high degree of certainty. The recommendation was to recompile the system with an artificially introduced delay in the processing thread.
As an alternative of creating a one-off build and deploying on a highly used system I thought it would be worthwhile to see if GDB would serve the purpose instead. The idea would be to attach to the process remotely, introduce a breakpoint within the processing thread which when reached would 'sleep' sufficiently to slow the processing thread sufficiently.
If we assume the while-loop represents the processing thread we wish to slow, setting a breakpoint at line 20 will start us off. Then, we need to register a sequence of commands with hitting the breakpoint, specifically sleeping for X seconds, then continuing on with the program. The following GDB command file does just that:
Line 1 adds the breakpoint, followed by lines 2-6 consist of the commands run when tripping the breakpoint. Line 3, 'silent' disables the usual message about stopping at the breakpoint, if you elect to not silence the message you'll likely need to set pagination off otherwise the debugger will pause once the terminal is filled with debugging content and prompts you to continue. Line 4 executes a shell command, sleeping 3 seconds, followed by line 5 which continues the program. Line 6 ends the command sequence.
The last line, line 7, will begin running the program after registering the breakpoint. As an alternative, you could issue the 'r' command interactively.
Compile the program as you would normally with debugging symbols.
$ gcc -g main.cpp -o main
Run via debugger, and associated GDB script by issuing:
$ gdb -x ./gdb.cmd ./main

GNU gdb (Ubuntu 7.11.1-0ubuntu1~16.04) 7.11.1

Copyright (C) 2016 Free Software Foundation, Inc.

License GPLv3+: GNU GPL version 3 or later <http://gnu.org/licenses/gpl.html>

This is free software: you are free to change and redistribute it.

There is NO WARRANTY, to the extent permitted by law.  Type "show copying"

and "show warranty" for details.

This GDB was configured as "x86_64-linux-gnu".

Type "show configuration" for configuration details.

For bug reporting instructions, please see:

<http://www.gnu.org/software/gdb/bugs/>.

Find the GDB manual and other documentation resources online at:

<http://www.gnu.org/software/gdb/documentation/>.

For help, type "help".

Type "apropos word" to search for commands related to "word"...

Reading symbols from ./main...done.

Breakpoint 1 at 0x4006de: file main.cpp, line 20.

main.cpp:16) main process initializing

(main.cpp:19) 1476848880.178461

(main.cpp:19) 1476848883.681235

(main.cpp:19) 1476848887.184019

(main.cpp:19) 1476848890.686872

(main.cpp:19) 1476848894.189695

(main.cpp:19) 1476848897.692520

(main.cpp:19) 1476848901.195763

(main.cpp:19) 1476848904.699169

(main.cpp:19) 1476848908.201601

(main.cpp:19) 1476848911.704499

(main.cpp:19) 1476848915.207383

(main.cpp:19) 1476848918.710270

(main.cpp:19) 1476848921.326889
^C
(main.cpp:19) 1476848921.826974

(main.cpp:19) 1476848922.327060

(main.cpp:19) 1476848922.828102

(main.cpp:19) 1476848923.329105

(main.cpp:19) 1476848923.829189

(main.cpp:19) 1476848924.329266
Program received signal SIGINT, Interrupt.

(gdb) q

Quit anyway? (y or n) y

$
Notice by the time stamps that the loop is running at ~3 secs, at least until hitting Control-C when resumes normal execution without the debugger breakpoint.
Seems like a viable alternative. I've intentionally overlooked the complexity of attaching to a remote process but the proof-of-concept seems viable.
I began with an overall objective of being able to:
1) get a list of the top 100 songs for a given year from the Billboard Charts
2) perform a search for each song on YouTube using the title and artist
3) download the song
4) overlay the title/artist on the video
5) finally, create a video collage consisting of a 30 sec video clip for each song
Let's walk through the steps. Let's focus on the year 1994 to pay tribute to the high school graduation year of my good friend Marshall, likely the only reader of this blog. That shows true dedication 'Old Fashioned', poor judgement in good use of your time, but true dedication.
I first took the path of parsing the HTML and extracting the music list into a series of strings but I later abandoned that effort by dusting off an old tool that I last used back in college, say 1996-1998'ish. Lynx is a text-based web browser with a sexy little secret, the ability to dump to a text file, making parsing the contents significantly easier.
This command will perform a Youtube search and prioritize videos of MP4 format. The output specifies a prefix, there is not guarantee as to the format. While there are pages of documentation on Youtube-dl we won't get into detail here, know however you can tailor your search to limit format, quality, resolution. frame-rate,.... Given we aren't constraining such video qualities we'll enforce some constraints post-processing the videos after we've downloaded them. We can ensure a H264 format within an MP4 container by examining what was downloaded and reencode it if necessary;
This is a good stage to generate a PNG image to overlay that consists of the List #, Artist and Title:
$ convert -background white -fill black -font FreeSerif-Italic -pointsize 46 label:"1 - Ace of Base - The Sign" 001.png
Step 4 -- Overlay the Title/Artist on the Video
Ensuring the videos share consist resolution and frame-rate will make our lives much easier. For instance, the the font size of overlay PNG is aimed at 720p videos. When we later concatenate the videos into a single video you'll find the input videos need to share a consistent frame-rate or the audio falls out of sync and video can stall out. Let's transcode the Youtube video, normalize it to 720p, 30fps and let's seek in 60 seconds and grab a 30 sec clip.
For the observant reader, you may notice the overlay position of (H-56), this places the PNG image at x,y location 0,720-56. For purposes of understanding, I provided the height dimension of the PNG image which places the overlay where we want it.
Step 5 -- Concatenate the Videos
The last step was the one that gave me the most trouble and made me miss my self-enforced blog deadline last week. Concatenating the videos occasionally resulted in stalled video or Kung Fu Theatre style audio out-of-sync issues. Despite many a Google search, I finally found through extensive debugging that the cause of the problem was supplying input videos that didn't have a consistent frame-rate so take care to enforce that before attempting this step like we did in the previous step.
Concating the videos is pretty straightforward: 1) provide a list of video files in a text file and 2) issue a concat filter via FFMpeg.
$ cat files.txt
file 'clip-001.mp4'
file 'clip-002.mp4'
file 'clip-003.mp4'
file 'clip-004.mp4'
The text file (e.g. files.txt) needs to be located in the same working directory where you issue the FFMpeg command.
As my work-day on Thursday was approaching the end, I was facing a predicament. I had kicked off a long-running command that was uncompressing some 5000+ files earlier in the day, not knowing how long it would take. It appeared that it would complete in the next couple hours and while I wanted to kick off some tests afterwards, I really didn't want to stick around until it completed.
Often, when this happens I would guess-timate the remaining time and issue a 'sleep' followed by the subsequent command. Trouble is, what if I over-guessed? Wasting valuable execution time. Worst, what if I under-guessed? A kicked off subsequent command could likely fail and the overnight opportunity would be wasted. Had I anticipated this situation, I'd simply have created a script with each step and the timing would work itself out. Unfortunately, I hadn't done so and stopping and restarting the command sequence seemed undesirable.
The 'kill' command seems to be the answer.
The steps include:
1) issuing the 'ps -aef' command to identify the process id of the command you wish to wait for
2) write an interactive script, or script file if you wish, that loops waiting for that process to complete
3) run the subsequent commands
Start by running some long command;
$ ./longCommand
Open an independent terminal and identify the process id of the 'long command';
$ ps -aef | grep longCommand
user 8186 7903 0 21:34 pts/2 00:00:00 /bin/bash ./longCommand
user  8207  8195  0 21:35 pts/17   00:00:00 grep --color=auto longCommand

$
Then, wait for this process to complete;
$ while kill -0 8186; do sleep 5; done; echo "done"
Followed by running whatever subsequent command(s) you wish.
The following video demonstrates this for your amusement.
Occasionally I find long running and output intensive tasks often are hindered by stdout buffering. The most apparent evidence of this is lags in the output followed by bursts of output, regardless of whether its run interactively or redirected output to a file.
The root cause is a default 4K buffer which can have performance advantages, but a hindrance if you're anxious to see the output. This often is a point of aggravation when running lengthy tests while redirecting stdout to a file to allow:
1) actively monitoring the current state of tests and
2) providing a 'report' (often lengthy) that can be reviewed after the fact.
The following video shows an example of this buffering. A simple python script, iterating 1024 times with a 0.05 sec delay between iterations, writing a simple message per iteration. The desired affect is to observe each loop iteration in the output file (monitoring via 'tail -f'). You'll see however the stdout buffering gets in the way.
./run > /tmp/run.log
The stdout buffering can be disabled the 4K buffering via pre-pending the stdbuf command to the same command; 'stdbuf -oL' enables line buffering instead.
Trace logging of significant events is a fundamental method for debugging and isolating errors encountered. User warnings, pop-up notification boxes, and application-level log files are one way to go. Another; to make use of the standard system log services found on *nix systems. The remainder of this post will some brief information I've recently discovered concerning interfacing with the system log services.
which allows for variable-lengthed argument lists, much like printf. The interface is pretty simple, the first argument specifies a priority or type of log statement; the second, a formatted string in the same form that printf takes.
A simple C
#include <stdio.h>

#include <syslog.h>


int main(int argc, char *argv[]) {

  syslog(LOG_NOTICE,"%s process started", argv[0]);

  sleep(3);

  syslog(LOG_NOTICE,"%s process terminating", argv[0]);
}
Compile and running this example will result in two log entries in the system logs. Determining what log will contain the log statements can be determined by:
1) the log type, and
2) the /etc/syslog.conf file.
Note, that the log type is defined as LOG_NOTICE, and the entry in the syslog.conf file entry;
In the past series of posts I focused on using Matlibplot and Python to generate plots. While the value of plots is not revolutionary, the ease of generating plots with Python and this library makes it worthwhile holstering in 'Ye, Ole Engineering Toolbox'.
I had the sincere opportunity of working with a talented controls engineering department early in my career and acquired a number of life-long experiences. One of the most significant of which was seeing the significant value in live plotting as an integration and debugging tool. With dozens of servo controllers, coordinated by multiple sequencers made for a sophisticated system and GDB simply wouldn't cut it for debugging purposes. Enter 'Simplot', the plotting utility for Matlab, which with relative ease allowed plotting the sequencer state engine as well as the multitude of controller commands and responses. As the turret moved it wasn't uncommon for the inertia to vibrate or bump a motion controller out of position and stall out the sequencer. Rendering real-time plots would demonstrate such scenarios with ease and expedite the debugging and iterative development process and made engineering marvels like this a reality:
I took the liberty of simulating the type of plots used, demonstrated in the following video.
If interested, the Python simulation and plotting is available for your amusement as well.
In the previous posts we've set the stage for some simple Python plotting. First, we demonstrated the generation of a data set followed by plotting it thereafter. In the second post, we demonstrated how we could plot 'live' data in real-time. The astute reader would have observed that over time the 'live' plot will slow down which will result in eventually falling behind plotting the data we're interested in. This is because an ever-increasing data set will greedily consume the available memory and an ever-increasing data set will eventually grow to an unmanageable size for plotting.
This post will focus on remedying such slow downs by constraining the data set to a manageable size. We'll also demonstrate some of the multi-plot capabilities of MatlibPlot.
Let's get started;
Reviewing the functionality from the past post, we can plot a 'live', ever-growing data set by something of the following sort: #!/usr/bin/python from pylab import *; import time; import collections; import re; def log(M): print "__(log) " + M; schedEventLoopTime=0.01; MaxX=50.0; MaxLen=10; def test00(): #--plots a dynamic, continuously growing 2D data set in an autoscaling simple graph plt.ion(); fig=plt.figure(1); ax1=fig.add_subplot(111); l1,=ax1.plot(100,100,'r-'); D=[]; i=0.0; while (i < MaxX): D.append((i,sin(i))); T=[x[0] for x in D]; L=[x[1] for x in D]; l1.set_xdata(T); l1.set_ydata(L); ax1.relim(); ax1.autoscale_view(); plt.draw(); i+=0.10; plt.pause(schedEventLoopTime); show(block=False); plt.close(); #---main--- log("main process initializing"); test00(); log("main process terminating");
A slight modification can increase the plotting performance by constraining the data set to a fixed size; note the use of the collection. def test02(): #--plots a dynamic, fixed-length 2D data set in an autoscaling simple graph plt.ion(); fig=plt.figure(1); ax1=fig.add_subplot(111); l1,=ax1.plot(100,100,'r-'); D = collections.deque(maxlen=MaxLen); i=0.0; while (i < MaxX): D.append((i,sin(i))); T=[x[0] for x in D]; L=[x[1] for x in D]; l1.set_xdata(T); l1.set_ydata(L); plt.ylim([min(L),max(L)]); plt.xlim([min(T),max(T)]); plt.draw(); i+=0.10; plt.pause(schedEventLoopTime); show(block=False); plt.close();
The use of the collection allows pre-allocation of a fixed array, appending to a full array will simply push out the oldest value. The 'live' plot is constrained to a fixed data size, resulting in a plot resembling this;
We'll use the same fixed-sizing concept in a multi-plot example; def test03(): #--plots a dynamic, fixed-length 2D data set in an autoscaling multi-plot graph plt.ion(); fig=plt.figure(1); ax1=fig.add_subplot(311); ax2=fig.add_subplot(312); ax3=fig.add_subplot(313); l1,=ax1.plot(100,100,'r-'); l2,=ax2.plot(100,100,'r-'); l3,=ax3.plot(100,100,'r-'); time.sleep(3); D = collections.deque(maxlen=MaxLen); i=0.0; while (i < MaxX): D.append((i,sin(i),cos(i),cos(i*2))); T1=[x[0] for x in D]; L1=[x[1] for x in D]; L2=[x[2] for x in D]; L3=[x[3] for x in D]; l1.set_xdata(T1); l1.set_ydata(L1); l2.set_xdata(T1); l2.set_ydata(L2); l3.set_xdata(T1); l3.set_ydata(L3); ax1.set_xlim([min(T1),max(T1)]); ax1.set_ylim([min(L1),max(L1)]); ax2.set_xlim([min(T1),max(T1)]); ax2.set_ylim([min(L2),max(L2)]); ax3.set_xlim([min(T1),max(T1)]); ax3.set_ylim([min(L3),max(L3)]); plt.draw(); i+=0.10; plt.pause(schedEventLoopTime); show(block=False); plt.close();
The result is a 'live' multi-plot that looks like the following;
In my previous post we described plotting data using MatplotLib utilities and Python. While this may be valuable, it becomes notably more valuable when you can generate 'live' plots during run-time. In a past employment I worked with a series of controls engineers that utilized real-time data plots to debug and develop a highly complex multi-axis weapons system and it was the first time I understood how a real-time plot of sequence of steps simplified the development effort.
Let's get started.
Unlike the previous post, let's create the data and plot it as it is generated.
$ cat rtPlot #!/usr/bin/python from pylab import *; import time; def log(M): print "__(log) " + M; def test01(): plt.ion(); fig=plt.figure(1); ax1=fig.add_subplot(111); l1,=ax1.plot(100,100,'r-'); time.sleep(2.0); D=[]; i=0.0; while (i < 50.0): D.append((i,sin(i))); T=[x[0] for x in D]; L=[x[1] for x in D]; l1.set_xdata(T); l1.set_ydata(L); ax1.relim(); ax1.autoscale_view(); plt.draw(); i+=0.10; plt.pause(1/10.0); show(block=True); #---main--- log("main process initializing"); test01(); log("main process terminating");
The result is a dynamically generated plot that resembles the following:
Tie this plotting routine to a system providing run-time information via a socket, or perhaps monitoring network traffic via pcapture libraries and you've got yourself the foundation of a real-time data monitoring system.
In my previous post we described plotting data using MatplotLib utilities and Python. While this may be valuable, it becomes notably more valuable when you can generate 'live' plots during run-time. In a past employment I worked with a series of controls engineers that utilized real-time data plots to debug and develop a highly complex multi-axis weapons system and it was the first time I understood how a real-time plot of sequence of steps simplified the development effort.
Let's get started.
Unlike the previous post, let's create the data and plot it as it is generated.
$ cat rtPlot #!/usr/bin/python from pylab import *; import time; def log(M): print "__(log) " + M; def test01(): plt.ion(); fig=plt.figure(1); ax1=fig.add_subplot(111); l1,=ax1.plot(100,100,'r-'); time.sleep(2.0); D=[]; i=0.0; while (i < 50.0): D.append((i,sin(i))); T=[x[0] for x in D]; L=[x[1] for x in D]; l1.set_xdata(T); l1.set_ydata(L); ax1.relim(); ax1.autoscale_view(); plt.draw(); i+=0.10; time.sleep(1/10.0); show(block=True); #---main--- log("main process initializing"); test01(); log("main process terminating");
The result is a dynamically generated plot that resembles the following:
Tie this plotting routine to a system providing run-time information via a socket, or perhaps monitoring network traffic via pcapture libraries and you've got yourself the foundation of a real-time data monitoring system.
Scripting languages are incredibly powerful, but more powerful when you can visualize the data you are processing. In this post, we will demonstrate how to quickly plot data sets via Python.
Start with installing Python and a plotting utility known as MatplotLib;
$ sudo apt-get install python python-matplotlib
Then, let's start with a classic plot, sin(x);
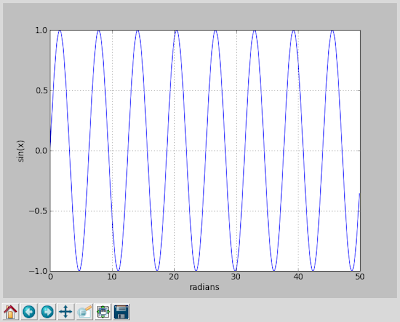
$ cat pyPlotTest #!/usr/bin/python from pylab import *; import time; def log(M): print "__(log) " + M; def test00(): D=[]; i=0.0; while (i < 50.0): D.append((i,sin(i))); i+=0.10;
plt.ion(); xlabel('radians'); ylabel('sin(x)'); grid(True); plt.figure(1); show(); T=[x[0] for x in D]; L=[x[1] for x in D]; plt.plot(T,L,'b-'); show(block=True); #---main--- log("main process initializing"); test00(); log("main process terminating");
The result is calculating a data set followed by plotting the data and allowing the user to manipulate the plots (e.g. zooming, panning, ...).
Running the script and you'll be presented with the following interactive graph;
The graph is interactive, allowing panning, zooming and such. It provides similar capabilities as gnuPlot, for those of you familiar with that utility. This short example demonstrates the simplest of examples. The library provides a full feature plotting solution for far more advanced plots, such as:
As a way of paying homage to the history and players that set me on the life-long path of Computer Science I chose to take two key players from my journey and simply mash their names together.
Commodore 64 (C-64)
While I didn't know it at the time, the year 1984 really set the stage for the rest of my life. The Commodore 64 was routinely portrayed on television time and time again and it's allure simply captivated me. At $595, available at K-Mart, alas it seemed out of reach for this simple townie. It's less sexy and less expensive sister, the VIC-20 however was a bit more approachable for this young lad.
I remember saving my pennies from a campaign of precision lawn mowing for months across our entire town until the day was reached that I had enough to execute my purchase. Armed with a carefully counted wad of bills I persuaded my folks to drive me to K-Mart for my triumphant purchase. As I clutched my prize in my skinny little fingers, my father talked to the sales associate about the C-64 and asked me "Why don't you get this one?", to which I replied "I don't have enough to afford it.". My father, after a brief discussion with my mother said they'd borrow me the remainder of the money. To this day, I'm not confident I've ever sufficiently repaid them as this purchase set the course for the majority of my adult career.
It likely will come as a surprise to many younger folks, but at the verge of the PC revolution computers like the C-64 didn't come armed with hard-drives, floppy-drives or persistent storage of any kind. That, my friend, was an accessory and frankly one that I couldn't afford for the better part of a year in the form of a 2nd hand C-64 datasette. Until that time, there was no means of saving anything. Every time you turned off your computer you lost everything. Painful intellectual torture, but the repetition nearly tattooed the syntax of Commodore BASIC into my young impressionable mind.
Daily, I'd flip the small gray power button on my electronic friend and be greeted by the far too familiar system prompt and I'd tap away at the keyboard down my next journey down geekhood.
Dragon Quest
My newly acquired debt and a depleted piggy bank left me little options for exploring the secrets of this electronic beauty. If I wanted this thing to do interesting things, I'd have to program it. Enter 'Run' magazine.
A good friend of mine had a father that worked at a magazine distributor which allowed him access to a near never-ending supply of magazines free of charge. While Playboy's were the most highly sought after prize, he had access to nearly every magazine distributed in the city including copies of 'Run Magazine'. In the days that predated the Internet and a town without a library, this opened the tech knowledge door for this broke trailer-park kid at a price I could afford *free*.
Run magazine was marketed to C-64 users, mostly hobbyists, and offered source code listings for programs submitted by other users. These programs could simply be typed in by other users, opening a new knowledge stream for this small-town boy. The 1st program listing I painstakingly entered was a program listing called 'Dragon Quest' from issue #5. I recently learned as part of this posting that the program was authored and submitted by a gentleman (Tom Meixner) who lived ~50 miles from where I live today; small world.